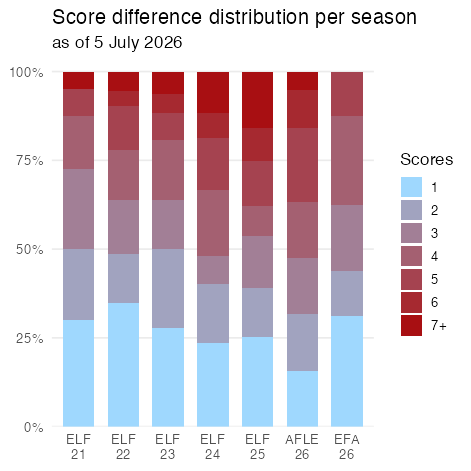
How close are the games in EFA and AFLE compared to ELF seasons? Let’s have a look at score differences. On score games are defined as having a maximum of eight point difference, two score games with 16 points difference, and so on.
ELF has drifted steadily toward blowouts over its five seasons. In 2021, one-score games were the single most common outcome (30.0%) and only 12.5% of games were decided by five or more scores. By 2024 and 2025 that pattern had flipped: 5+ score blowouts became the most frequent category, climbing to 33.3% and then 37.9%, while nailbiters slipped back into the low-to-mid 20s.
The two newer leagues sit at opposite ends of that spectrum. EFA’s debut season looks like ELF’s early years - nearly a third of games (31.2%) are one-score affairs, and blowouts make up just 12.5%, making it the most balanced season in the table. AFLE’s first season is the opposite case: outcomes are split almost evenly across the first four categories (15.8% each), but more than a third of games (36.8%) still end in a 5+ score blowout - a competitive spread that looks close to where ELF ended.
| season\scores | 1 | 2 | 3 | 4 | 5+ |
|---|---|---|---|---|---|
| ELF 21 | 30.0% | 20.0% | 22.5% | 15.0% | 12.5% |
| ELF 22 | 34.7% | 13.9% | 15.3% | 13.9% | 22.2% |
| ELF 23 | 27.7% | 22.3% | 13.8% | 17.0% | 19.1% |
| ELF 24 | 23.5% | 16.7% | 7.8% | 18.6% | 33.3% |
| ELF 25 | 25.3% | 13.7% | 14.7% | 8.4% | 37.9% |
| EFA 26 | 31.2% | 12.5% | 18.8% | 25.0% | 12.5% |
| AFLE 26 | 15.8% | 15.8% | 15.8% | 15.8% | 36.8% |